Testing Times For Interferometers
Interferometry is a long-established method for the testing of
optical components and systems. By measuring the distortions in a
wavefront interacting with a test piece compared to a reference
beam, aberrations in optical systems, badly manufactured optical
components and inhomogeneities in materials can be identified. The
interference between the test beam and the reference beam appears
as a set of light and dark fringes which yield information related
to surface form errors or optical waveform distortion errors. The
use of PC-based software to automate the fringe analysis and
measurement processes has catapulted interferometry into the
realms of "routine analysis" instrumentation, where
users with little knowledge of optics can be expected to carry out
interferometric investigations. However, good practice in
measurement methodology should not be jettisoned simply because an
instrument is software controlled. Interferometric measurements
can vary from comparative tests applying visual assessment -
generally used for relatively low accuracy results - to a
calculation of the complete geometrical properties of an optical
system. Commonly required measurements, however, are those of form
error both for flat and spherical optics. Since all measurements
are based on analysis of the fringe patterns, attention to detail
in their generation and stability is of paramount importance.
Good Practice
The quality of results obtained depends on the quality of the
interferometer and the reference optics used. A high quality
reference optic is essential as a beam splitter and may be
specified as
l/20 or better peak to valley for transmission flats and l/10 or
better for transmission spheres, where l = 633 nm. For long
wavelength interferometers, the references may be significantly
better than this. Most software allows the subtraction of errors
due to the reference components from the measured wavefront which
relaxes the requirements for component accuracy somewhat. However,
it is never completely certain that the same part of a reference
component is being used, particularly if a wedged or decentred
optical component has been inserted for measurement.
For the best results, all optical components should be mounted on
a vibration-isolated optical bench. Whilst this is less critical
for low accuracy comparative tests, it is absolutely essential for
high accuracy phase shift analysis during which individual
snapshots can be affected by vibration. During a statistical run
of measurements, it is possible to see the effects on the results
by the operation of plant machinery nearby, or the cutting-in of
air conditioners. Air turbulence which could arise from air
conditioners or forced convection in an open room, or the
proximity of heat generating electronic equipment cannot be
eliminated by anti-vibration systems. If critical measurements
including long path lengths are to be made, it is often necessary
to shield the equipment from sources of air convection.
The test beam and reference beam must follow an identical path
inside the interferometer and the test beam must retrace its path
accurately. Internal instrument alignment procedures as stipulated
by the manufacturer must be followed and external optical
components including the test piece and reference optics must also
be carefully aligned along the optical axis of the interferometer.
Accurate focusing of the optical pupil is also important,
particularly at wavelengths in the infra-red, to avoid erroneous
interpretation of results. Diffracted light will also interfere
with the reference beam so the optical aperture of the system
under test should be focused onto the camera sensitive surface.
Diffraction effects arising from double pass configurations may be
cured by imaging the optical pupil onto the interferometer camera
both directly, and via the reference mirror or sphere. If the
system under test has a larger physical diameter than the used
aperture then it may be measured over the larger aperture and then
masked in software to the used aperture to keep the effects of
diffraction away from the pupil zone analysed.
When performing a measurement, as much of the interferometer's
pupil as possible should be used, to maximise the number of data
points in the measurement data. An optical zoom system or other
aperture adapter is essential to provide such pupil matching.
Electronic zoom simply enlarges both the image and pixels without
giving any more data. It is also essential that the correct area
of the component under test is measured. Optical components are
usually defined to have a clear aperture over which the wavefront
is controlled. If the component is significantly larger than the
clear aperture, then extraneous zones should be ignored by masking
physically or in software.
Fringe Analysis
Following optimisation, the fringes must be analysed. Traditional
analysis is performed by simply printing the interferogram and
measuring deviations with a ruler. More recently the image is
captured digitally using a framegrabber and software used to
analyse the fringes. This is known as static fringe analysis.
Typically this offers an accuracy of around l/20 and has the
benefit that the software results can be verified manually for
simple peak to valley measurements. Software offers far more
sophisticated analysis including calculation of the rms wavefront
deviation, and other derived functions such as the Strehl Ratio,
MTF, Point Spread Function and Encircled Energy Function. To get
the most out of this software, users will almost certainly have to
intervene to manually shift measurement points which have been
misplaced. This may be due to changes of contrast in the
interferogram, or points placed midway between a fringe and the
edge of the pupil. Static fringe analysis does not provide many
data points within the test pupil so that data at other points
must always be interpolated or extrapolated. The wavefront shape
is often approximated by fitting Zernike coefficients to the
available data. This is normally fine for interpolated zones of
the test pupil but for large order coefficient fitting, the
extrapolated data can vary widely from the actual wavefront.
Ideally, measurements should always be made over a larger area
than required and the aperture reduced in software. Other
extrapolation methods such as Spline fitting or simply linear
extrapolation will give different results especially for peak to
valley measurements.
Phase shifting techniques can improve accuracy by capturing the
fringes with several different phases of the reference beam. This
permits calculation of absolute phase for every pixel within the
pupil which increases accuracy and repeatability of measurements
to around l/100, and allows the sense of the fringe perturbation
to be identified as a wavefront retardation or advance. Because
the multiple measurements are made at different times, the
measurement is more susceptible to vibration than static fringe
analysis.
The above techniques may provide repeatable, but not necessarily
correct results. Systematic errors may bias the results in one
direction. These may be due to misalignment, distortion due to
gravity, or distortion due to the mounting technique employed for
components. Flimsy components especially should be mounted
mimicking their final application mount and orientation. A
vertically mounted interferometer may be required to mount
components without asymmetric stresses.
International Standards
The basic methodology for making measurements is extremely
important in spite of the introduction of sophisticated software.
In addition, since different manufacturers' software use different
algorithms for their calculations and extrapolations, there is a
clear need for an international standard to avoid variations in
actual performance levels compared to quoted capability. With such
a standard, both methodology and software could be evaluated prior
to "real" measurements. The relevant technical committee
of the International Standards Organisation (ISO) has already
initiated the writing of a draft standard on this topic and
Precision-Optical Engineering recently participated with other
manufacturers and laboratories in a "round robin"
evaluation1 of interferometers and laboratories, organised by the
corresponding committee of the British Standards Institution (BSI)
to survey existing practice.
It is hoped that the introduction of such a standard will be
welcomed throughout the industry.
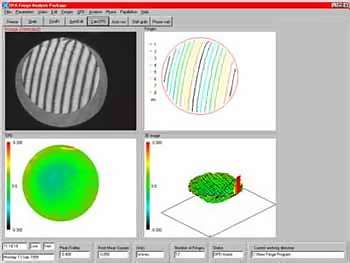
Figure 1. Static fringe analysis output from P-OE's INTERFIRE
633 interferometer showing digitisation of fringes and 2-D
and 3-D representations of the Optical Path Difference of the
measured sample.

Figure 2. Results from the INTERFIRE 633 interferometer equipped
with P-OE's new phase shift analysis system.
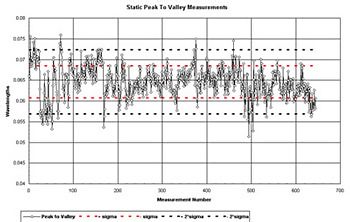
Figure 3. Variation of measurement with static fringe analysis
over 600 measurements.
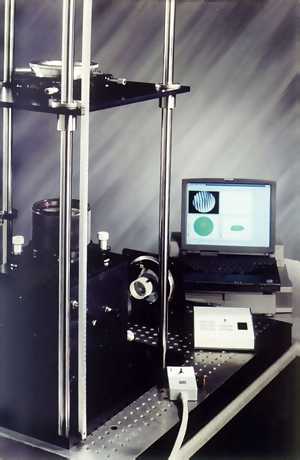
Figure 4. VLS II integrated vertical looking
interferometric workstation for vertical testing
of components.
Reference1Interferometric optical testing: an interlaboratory
comparison, J. D. Briers, Journal of Optics A, Pure & Applied
Optics, 1, 1, 1999.
|
|